Each individual tastes each of the three colas. Between tastes subjects eat a soda cracker. Each subject receives the colas in a different order. Each subject then selects which soda he/she likes best.
Results: Pepsi 85, Coke 57, RC 78.
| O | E | O-E | (O-E)2 | (O-E)2/E | |
|---|---|---|---|---|---|
| Pepsi | 85 | 73.33 | 11.67 | 136.19 | 1.86 |
| Coke | 57 | 73.33 | -16.33 | 266.67 | 3.64 |
| RC | 78 | 73.33 | 4.67 | 21.81 | 0.3 |
| Totals | 220 | 219.99 | χ2 = | 5.8 |
df = rows - 1 = 3 - 1 = 2.
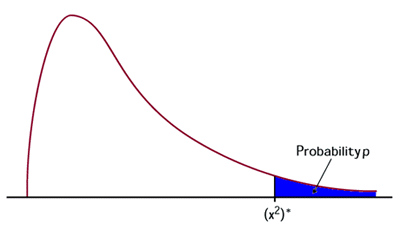
Critical value of χ2 = 5.99 at alpha = 0.05.
Observed value of χ2 = 5.8.
Decision: Fail to reject H0.
clear

input o
85
57
78
end

generate e = 220/3

chitest o e

observed frequencies from o; expected frequencies from e

         Pearson chi2(2) =   5.7909   Pr =  0.055
likelihood-ratio chi2(2) =   5.9984   Pr =  0.050

  +-------------------------------------------+
  | observed   expected   obs - exp   Pearson |
  |-------------------------------------------|
  |       85     73.333      11.667     1.362 |
  |       57     73.333     -16.333    -1.907 |
  |       78     73.333       4.667     0.545 |
  +-------------------------------------------+
She wants to test the absences at the 0.1 significance level.
| O | E | O-E | (O-E)2 | (O-E)2/E | |
|---|---|---|---|---|---|
| Mon | 73 | 61 | 12 | 144 | 2.4 |
| Tue | 57 | 61 | -4 | 16 | 0.3 |
| Wed | 48 | 61 | -13 | 169 | 2.8 |
| Thu | 59 | 61 | -2 | 4 | 0.1 |
| Fri | 68 | 61 | 7 | 49 | 0.8 |
| Totals | 305 | 305 | χ2 = | 6.4 |
df = rows - 1 = 5 - 1 = 4.
Critical value of χ2 = 7.78 at alpha = 0.10.
Observed value of χ2 = 6.4.
Decision: Fail to reject H0.
clear

input o
73
57
48
59
68
end

sum o

    Variable |     Obs        Mean   Std. Dev.       Min        Max
-------------+-----------------------------------------------------
           o |       5          61    9.77241         48         73


generate e = r(sum)/5

chitest o e

observed frequencies from o; expected frequencies from e

         Pearson chi2(4) =   6.2623   Pr =  0.180
likelihood-ratio chi2(4) =   6.3196   Pr =  0.177

  +-------------------------------------------+
  | observed   expected   obs - exp   Pearson |
  |-------------------------------------------|
  |       73     61.000      12.000     1.536 |
  |       57     61.000      -4.000    -0.512 |
  |       48     61.000     -13.000    -1.664 |
  |       59     61.000      -2.000    -0.256 |
  |       68     61.000       7.000     0.896 |
  +-------------------------------------------+

 chitable 4

        Critical Values of Chi-square
 df     .50     .25     .10     .05    .025      .01     .001
  4    3.36    5.39    7.78    9.49   11.14    13.28    18.47
An SRS of 1220 individuals in 1995 found 585 Anglo, 390 Hispanic, 109 African-American and 136 Asian.
Have the demographics in the county changed greater then would be expected by chance
| O | E | O-E | (O-E)2 | (O-E)2/E | |
|---|---|---|---|---|---|
| An | 585 | 634.4 | 49.4 | 2,440.36 | 3.85 |
| H | 390 | 341.6 | 48.4 | 2,342.56 | 6.86 |
| AA | 109 | 146.4 | -37.4 | 1,398.76 | 9.55 |
| As | 136 | 97.6 | 38.4 | 1,474.56 | 15.12 |
| Totals | 1220 | 1220 | χ2 = | 35.38 |
df = rows - 1 = 4 - 1 = 3.
Critical value of χ2 = 7.81 at alpha = 0.05.
Observed value of χ2 = 35.38.
Decision: Reject H0.
clear

input o
585
390
109
136
end

input e
634.4
341.6
146.4
97.6
end

list

     +-------------+
     |   o       e |
     |-------------|
  1. | 585   634.4 |
  2. | 390   341.6 |
  3. | 109   146.4 |
  4. | 136    97.6 |
     +-------------+

chitest o e

observed frequencies from o; expected frequencies from e

         Pearson chi2(3) =  35.3669   Pr =  0.000
likelihood-ratio chi2(3) =  34.4401   Pr =  0.000

  +-------------------------------------------+
  | observed   expected   obs - exp   Pearson |
  |-------------------------------------------|
  |      585    634.400     -49.400    -1.961 |
  |      390    341.600      48.400     2.619 |
  |      109    146.400     -37.400    -3.091 |
  |      136     97.600      38.400     3.887 |
  +-------------------------------------------+
Now let's use the hsb2 dataset and the variable race.
use http://www.philender.com/courses/data/hsb2, clear

chitest race, count  /* down loaded from the Internet */

Chi-square test:
    observed frequencies from race
    expected frequencies equal

         Pearson chi2(3) = 242.4400   Pr =  0.000
likelihood-ratio chi2(3) = 203.5732   Pr =  0.000

                                   residuals
      observed    expected     classic     Pearson
  1.        24      50.000     -26.000      -3.677
  2.        11      50.000     -39.000      -5.515
  3.        20      50.000     -30.000      -4.243
  4.       145      50.000      95.000      13.435
Intro Home Page
Phil Ender, 28nov05, 22Nov00