univar mt2005 mt2004 mt2003 mt2002 mt2001 mt2000 mt1999

                                        -------------- Quantiles --------------
Variable       n     Mean     S.D.      Min      .25      Mdn      .75      Max
-------------------------------------------------------------------------------
  mt2005      35    94.11     5.36    73.00    92.00    96.00    98.00   100.00
  mt2004      31    92.26     7.17    72.00    88.00    94.00    98.00   100.00
  mt2003      26    93.38     7.37    76.00    90.00    95.00   100.00   100.00
  mt2002      32    97.34     2.51    89.00    96.00    98.00   100.00   100.00
  mt2001      22    97.16     2.97    91.00    94.50    98.50    99.50   100.00
  mt2000      34    94.94     4.35    83.00    93.00    96.50    98.00   100.00
  mt1999      19    92.68     5.97    77.00    88.00    94.00    98.00   100.00
 mt99-05     199    94.15     6.10    72.00    91.00    96.00    98.00   100.00
-------------------------------------------------------------------------------
summarize mt2005, detail
mt2005
-------------------------------------------------------------
Percentiles Smallest
1% 73 73
5% 85 85
10% 89 86 Obs 35
25% 92 89 Sum of Wgt. 35
50% 96 Mean 94.11429
Largest Std. Dev. 5.36202
75% 98 100
90% 100 100 Variance 28.75126
95% 100 100 Skewness -1.925834
99% 100 100 Kurtosis 8.005897
stem mt2005, lines(2) round(1)
mt2005 rounded to integers
7* | 3
7. |
8* |
8. | 56999
9* | 11222344
9. | 55666666777788888
10* | 0000
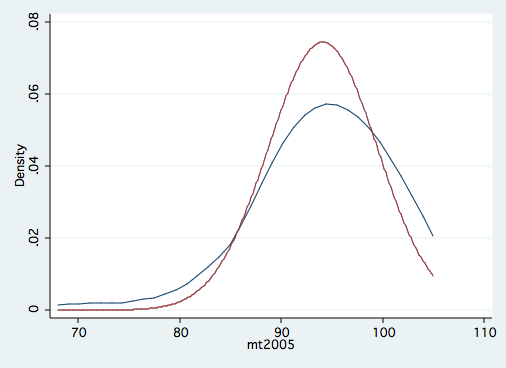
kdensity mt2005, width(5) normal legend(off)
summarize mt2004, detail
mt2004
-------------------------------------------------------------
Percentiles Smallest
1% 72 72
5% 79 79
10% 84 80 Obs 31
25% 88 84 Sum of Wgt. 31
50% 94 Mean 92.25806
Largest Std. Dev. 7.169229
75% 98 100
90% 100 100 Variance 51.39785
95% 100 100 Skewness -.929521
99% 100 100 Kurtosis 3.410234
stem mt2004, lines(2) round(1)
Stem-and-leaf plot for mt2003
mt2004 rounded to integers
7* | 2
7. | 9
8* | 044
8. | 7888
9* | 00002444
9. | 5666788
10* | 0000000
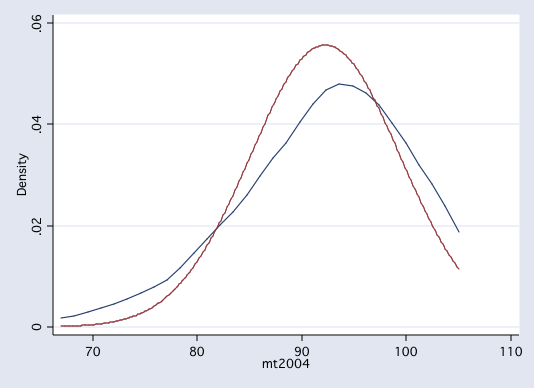
kdensity mt2004, width(5) normal legend(off)
summarize mt2003, detail
mt2003
-------------------------------------------------------------
Percentiles Smallest
1% 76 76
5% 82 82
10% 83 83 Obs 26
25% 90 84 Sum of Wgt. 26
50% 95 Mean 93.38462
Largest Std. Dev. 7.370628
75% 100 94
90% 100 96 Variance 54.32615
95% 100 98 Skewness -.8036409
99% 100 100 Kurtosis 2.412561
stem mt2003, lines(2) round(1)
Stem-and-leaf plot for mt2003
mt2003 rounded to integers
7. | 6
8* | 13334
8. |
9* | 0022344
9. | 688
10* | 0000000000
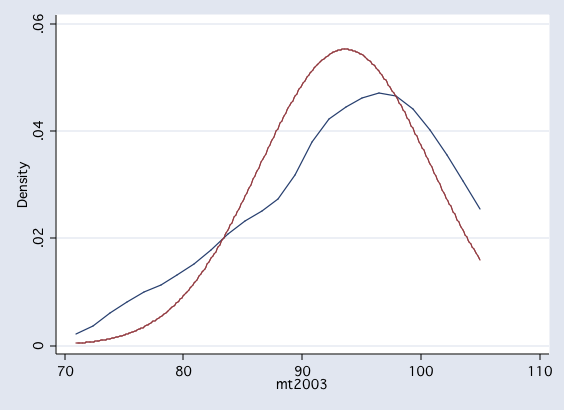
kdensity mt2003, width(5) normal legend(off)
summarize mt2002, detail
mt2002
-------------------------------------------------------------
Percentiles Smallest
1% 89 89
5% 94 94
10% 94 94 Obs 32
25% 96 94 Sum of Wgt. 32
50% 98 Mean 97.34375
Largest Std. Dev. 2.509458
75% 100 100
90% 100 100 Variance 6.297379
95% 100 100 Skewness -1.156459
99% 100 100 Kurtosis 4.835533
stem mt2002, lines(2) round(1)
Stem-and-leaf plot for mt2002
mt2002 rounded to integers
8. | 9
9* | 444
9. | 5566666678888888889
10* | 000000000
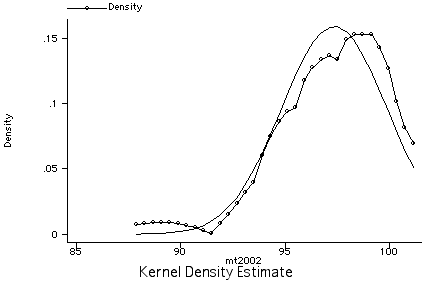
kdensity mt2002, xlabel ylabel normal
summarize mt2001, detail
mt2001
-------------------------------------------------------------
Percentiles Smallest
1% 91 91
5% 91.5 91.5
10% 93 93 Obs 22
25% 94.5 94 Sum of Wgt. 22
50% 98.5 Mean 97.15909
Largest Std. Dev. 2.965622
75% 99.5 100
90% 100 100 Variance 8.794913
95% 100 100 Skewness -.7673038
99% 100 100 Kurtosis 2.219118
stem mt2001, lines(2) round(1)
Stem-and-leaf plot for mt2001
mt2001 rounded to integers
9* | 1234
9. | 55577899999
10* | 0000000
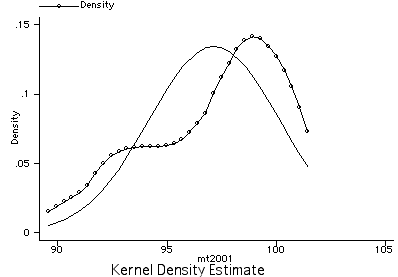
kdensity mt2001, xlabel ylabel normal
summarize mt2001, detail
mt2000
-------------------------------------------------------------
Percentiles Smallest
1% 83 83
5% 86 86
10% 89 87 Obs 34
25% 93 89 Sum of Wgt. 34
50% 96.5 Mean 94.94118
Largest Std. Dev. 4.348049
75% 98 99
90% 99 100 Variance 18.90553
95% 100 100 Skewness -1.068631
99% 100 100 Kurtosis 3.323842
stem mt2000, lines(2)
Stem-and-leaf plot for mt2000
8* | 3
8. | 67999
9* | 12344
9. | 55555677778888888899
10* | 000
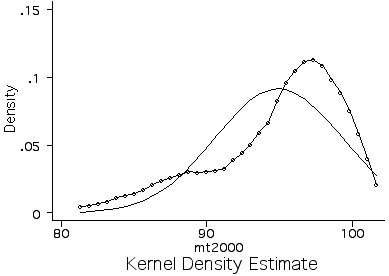
kdensity mt2000, xlabel ylabel normal
summarize mt1999, detail
mt1999
-----------------------------------------------------------
Percentiles Smallest
1% 77 77
5% 77 84
10% 84 86 Obs 19
25% 88 88 Sum of Wgt. 19
50% 94 Mean 92.68421
Largest Std. Dev. 5.972647
75% 98 98
90% 98 98 Variance 35.67251
95% 100 98 Skewness -1.019907
99% 100 100 Kurtosis 3.518102
stem mt1999
Stem-and-leaf plot for mt1999
7. | 7
8* | 4
8. | 688
9* | 02234
9. | 56688888
10* | 0
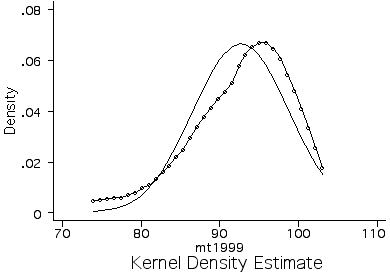
kdensity mt1999, xlabel ylabel
 summarize final, detail
final
-------------------------------------------------------------
Percentiles Smallest
1% 73 73
5% 73 74
10% 74 77 Obs 19
25% 85 80 Sum of Wgt. 19
50% 88 Mean 87.89474
Largest Std. Dev. 7.519565
75% 94 94
90% 98 95 Variance 56.54386
95% 99 98 Skewness -.5837628
99% 99 99 Kurtosis 2.505307
stem final, lines(2)
Stem-and-leaf plot for final
7* | 34
7. | 7
8* | 0
8. | 567778
9* | 012344
9. | 589
summarize final, detail
final
-------------------------------------------------------------
Percentiles Smallest
1% 73 73
5% 73 74
10% 74 77 Obs 19
25% 85 80 Sum of Wgt. 19
50% 88 Mean 87.89474
Largest Std. Dev. 7.519565
75% 94 94
90% 98 95 Variance 56.54386
95% 99 98 Skewness -.5837628
99% 99 99 Kurtosis 2.505307
stem final, lines(2)
Stem-and-leaf plot for final
7* | 34
7. | 7
8* | 0
8. | 567778
9* | 012344
9. | 589
Intro Home Page
Phil Ender, 16nov04