A normal distribution is said to be mesokurtic and has a 'normal' amount of peakedness and tails that are not too heavy nor too light.
There are several different but related formulae for computing kurtosis. The one given below is the one used by Stata.
kurtosis = m4/m22

where m2 = Σ(X - mean)2/N
      m4 = Σ(X - mean)4/N
The formula uses the second and fourth moments about the mean. Moments involve
powers of deviations, for example the second moment uses the sum of squared deviations and
the fourth moment uses the sum of the fourth powers of deviations.
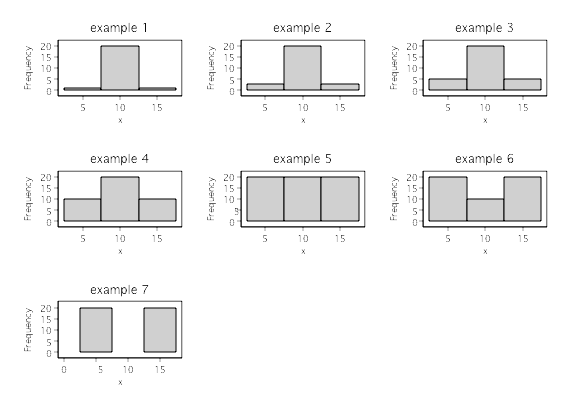
The second moment about the mean, m2, is really a version of the variance related to the unbiased estimate of the variance that uses N-1 in the denominator. Thus, the index of kurtosis is based on ratio of the fourth moment about the mean divided by the variance squared. In a normal distribution the kurtosis is equal to 3. A platykurtic distribution has a value less than three, while leptokurtic distributions have values greater than three. Below, are some examples to give you an idea of the values that kurtosis can take on.
Some statistics packages use the following formula for computing kurtosis.
kurtosis = (m4/m22) - 3With this version of the formula, a normal distribution has a kurtosis of zero.
ex 1: kurtosis = 11.00 ex 2: kurtosis = 4.33  ex 3: kurtosis = 3.00
ex 4: kurtosis =  2.00 ex 5: kurtosis = 1.50  ex 6: kurtosis = 1.25
ex 7: kurtosis =  1.00
The next example is extremely leptokurtic. It has a normal curve superimpossed over the histogram.
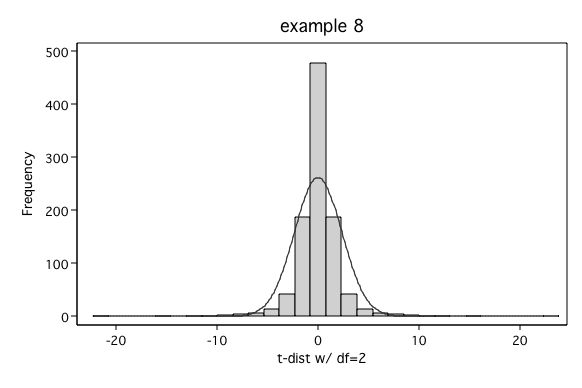
ex 8: kurtosis = 26.65Next we have an example that is less leptokurtic than the previous example and, in fact, does not have a terrible fit with a normal distribution.
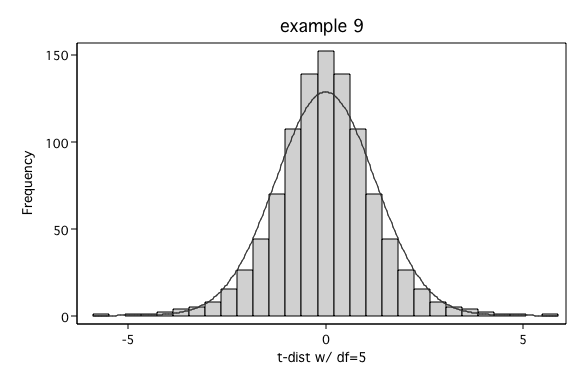
ex 9: kurtosis = 4.89The final example shows a normal distribution or at least as close as we can come to a normal distribution with 400 observations.
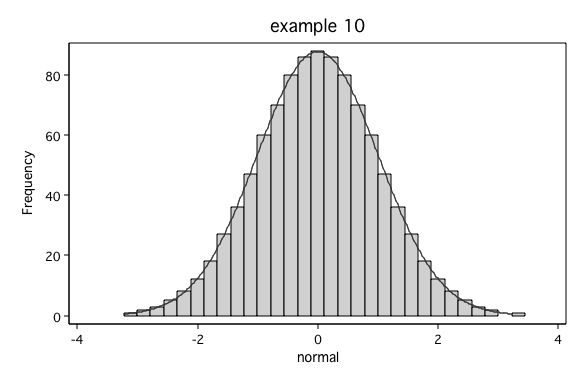
ex 10: kurtosis = 2.98
Intro Home Page
Phil Ender, 24Oct04