To a large extent, how good of a job a histogram does in displaying the shape of a distribution depends on how the data are grouped together. Too few bars and the histogram fails to reflect the shape of the distribution. However, there can also be too many bars, such that, it is like looking at the individual observations.
Here are some examples using the same variable but changing the number of vertical bars.
2 Bins
3 Bins
5 Bins
10 Bins
15 Bins
20 Bins
30 Bins
40 Bins
50 Bins
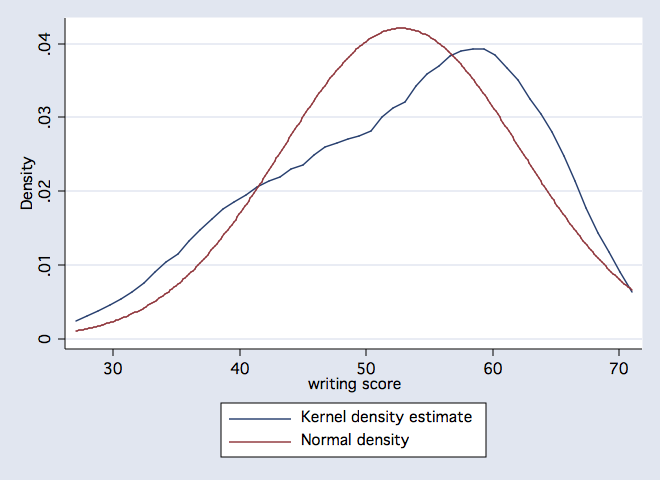
To some extend kdensity plots can get around the display issues surrounding histograms. Kdensity plots have an unlimited number of very thin bins which are smoothed by averaging over a several adjacent bins.
kdensity write, normal width(4)
Intro Home Page
Phil Ender, 13Oct99