Test Reliability
Test reliability refers to consistency of measurement, the extent to which the results are similar over different forms of the same instrument or occasions of test administration.
Test Validity
Test validity is the extent to which a test measures what it proports to measure. Also, the extent to which inferences made on the basis of test scores are appropriate, meaningful, and useful.
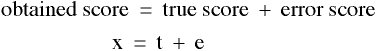
The Measurement Model
Where
x is the obtained score,
t is the true score, and
e is the error score (measurement error).
Measurement Model Variances
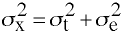
Where
σx2 is the variance of the obtained score,
&sigmat2 is the variance of the true score, and
σe2 is the variance of the errors.
Standard Error of Measurement
The standard error of measurement is the square root of the variance of the errors.
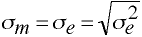
When the standard error of measurement is obtained from sample data it is often written as sm or se.
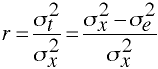
Definition of Reliability
Reliability is defined and the ratio of the true score variance to the observed score variance.
Methods to Assess Reliability
use http://www.philender/courses/data/alpha, clear

format id - i10 %4.0f

list, nodisplay noobs

  id    i1    i2    i3    i4    i5    i6    i7    i8    i9   i10
   1     2     2     2     2     1     2     2     2     2     1
   2     2     2     2     2     2     2     2     2     2     1
   3     2     2     2     2     2     2     2     2     2     1
[some output omitted]
  33     2     2     1     1     2     1     2     2     2     1
  34     2     2     2     2     1     0     0     2     0     0
  35     2     2     2     2     2     2     2     0     2     1

alpha i1 - i10, item

Test scale = mean(unstandardized items)

                         item-test     item-rest      interitem
Item     |  Obs  Sign   correlation   correlation    covariance       alpha
---------+--------------------------------------------------------------------
i1       |   35    +       0.3527        0.2223        .0495565      0.6073
i2       |   35    +       0.3248        0.2055        .0504902      0.6102
i3       |   35    +       0.2175        0.0683        .0534781      0.6306
i4       |   35    +       0.7369        0.6015        .0323529      0.5101
i5       |   35    +       0.7160        0.5812        .0338702      0.5195
i6       |   35    +       0.7512        0.5735        .0288515      0.5016
i7       |   35    +       0.5782        0.3820        .0392857      0.5689
i8       |   35    +       0.3226        0.0187        .0544118      0.6852
i9       |   35    +       0.4662        0.3119        .0453081      0.5899
i10      |   35    -       0.1148       -0.0281        .0562792      0.6432
---------+--------------------------------------------------------------------
Test                                                   .0443884      0.6185
---------+--------------------------------------------------------------------
More Item Analysis
Here is an example of an item analysis for a multiple choice test using mctest (available from ATS). The first row of the data gives the scoring key while the second row gives the number of choices for each item.
use http://www.philender.com/courses/data/items, clear

list

           i1        i2        i3        i4        i5        i6
  1.        4         1         1         4         1         3
  2.        4         4         4         4         4         4
  3.        1         2         1         2         1         3
  4.        4         2         4         1         1         2
  5.        4         2         1         4         1         3
  6.        1         4         4         4         3         3
  7.        2         4         4         2         1         1
  8.        4         2         1         1         4         3
  9.        4         2         1         4         1         3
 10.        1         3         1         1         4         1
 11.        4         3         4         4         1         2
 12.        4         2         1         4         1         3
 13.        4         4         4         3         1         3
 14.        4         1         4         4         3         3
 15.        4         2         1         4         1         3
 16.        4         2         1         4         1         3

mctest i1-i6, gen(score) delete

Multiple Choice Item Statistics
Number of items: 6  Number of observations: 14
(Note: point biserials computed with item deleted)
----------------------------------------------------------------------
          Prop    Disc    Point        Prop       Proportion     Point
Item     Correct  Index   Biser   Alt  Total   Low   Mid   High  Biser
----------------------------------------------------------------------
i1       0.71     0.75    0.48     1   0.21    0.50  0.14  0.00 -0.29
                                   2   0.07    0.25  0.00  0.00 -0.39
                                   3   0.00    0.00  0.00  0.00  0.00
                                   4   0.71*   0.25  0.57  1.00  0.48
                                   .   0.00    0.00  0.00  0.00
                                 Other 0.00    0.00  0.00  0.00

i2       0.07     0.00   -0.06     1   0.07*   0.00  0.14  0.00 -0.06
                                   2   0.57    0.25  0.29  1.00  0.68
                                   3   0.14    0.25  0.14  0.00 -0.37
                                   4   0.21    0.50  0.14  0.00 -0.47
                                   .   0.00    0.00  0.00  0.00
                                 Other 0.00    0.00  0.00  0.00

i3       0.57     0.75    0.20     1   0.57*   0.25  0.29  1.00  0.20
                                   2   0.00    0.00  0.00  0.00  0.00
                                   3   0.00    0.00  0.00  0.00  0.00
                                   4   0.43    0.75  0.43  0.00 -0.20
                                   .   0.00    0.00  0.00  0.00
                                 Other 0.00    0.00  0.00  0.00

i4       0.57     0.75    0.47     1   0.21    0.50  0.14  0.00 -0.36
                                   2   0.14    0.25  0.14  0.00 -0.28
                                   3   0.07    0.00  0.14  0.00  0.05
                                   4   0.57*   0.25  0.29  1.00  0.47
                                   .   0.00    0.00  0.00  0.00
                                 Other 0.00    0.00  0.00  0.00

i5       0.71     0.50    0.07     1   0.71*   0.50  0.43  1.00  0.07
                                   2   0.00    0.00  0.00  0.00  0.00
                                   3   0.14    0.25  0.14  0.00  0.11
                                   4   0.14    0.25  0.14  0.00 -0.20
                                   .   0.00    0.00  0.00  0.00
                                 Other 0.00    0.00  0.00  0.00

i6       0.71     0.75    0.48     1   0.14    0.50  0.00  0.00 -0.57
                                   2   0.14    0.25  0.14  0.00 -0.05
                                   3   0.71*   0.25  0.57  1.00  0.48
                                   4   0.00    0.00  0.00  0.00  0.00
                                   .   0.00    0.00  0.00  0.00
                                 Other 0.00    0.00  0.00  0.00

univar score

                                   -------------- Quantiles ---------------
Variable     n    Mean    S.D.     Min      .25      Mdn      .75      Max
---------------------------------------------------------------------------
   score    14    3.36    1.50     1.00     2.00     3.00     5.00     5.00
---------------------------------------------------------------------------
Standard Error of Measurement RevisitedIn practice the standard error of measurement is obtained in the following manner.
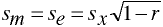
Where
sm = se is the standard error of measurement
sx is the standard deviation of the obtained scores
r is the estimated reliability.
Types of Validity
| Sta9 | 1 | 2 | 3 | 4 | 5 | 6 | 7 | 8 | 9 |
|---|---|---|---|---|---|---|---|---|---|
| % of cases | 4% (lowest) | 7% | 12% | 17% | 20% | 17% | 12% | 7% | 4% (highest) |
| SS | -2.326 | -1.645 | -1.28 | -0.84 | -0.67 | -0.52 | -0.25 | 0.0 | +0.25 | +0.52 | +0.67 | +0.84 | +1.28 | +1.645 | +2.326 |
|---|---|---|---|---|---|---|---|---|---|---|---|---|---|---|---|
| T | 26.74 | 33.55 | 37.18 | 41.59 | 43.26 | 44.8 | 47.5 | 50 | 52.5 | 55.2 | 56.74 | 58.41 | 62.82 | 66.45 | 73.26 |
| PR | 1 | 5 | 10 | 20 | 25 | 30 | 40 | 50 | 60 | 70 | 75 | 80 | 90 | 95 | 99 |
| NCE | 1 | 15.4 | 23 | 32.3 | 35.8 | 38.9 | 44.7 | 50 | 55.3 | 61 | 64.2 | 67.7 | 77 | 84.6 | 99 |
| Sta9 | 1 | 2 | 2 | 3 | 4 | 4 | 5 | 5 | 5 | 6 | 6 | 7 | 8 | 8 | 9 |
Band Intrepretation
The formula was Xbar ± CVz * sXbar.
We can do the same thing in the area of measurement with the formula
obtained score ± CVz*sm
where
CVz is the critical value obtained from the standard normal distribution
sm is the standard error of measurement.
If you use CVz = 1.96 then you would create a 95% confidence band. The correct interpretation of this confidence band would be that the true score will be found in 95% of all such confidence bands, which is very close to saying that there is a probability of .95 that the true score for this student falls within this confidence band.
Example:
Test 1: obtained score = 67, sm = 2.0
(63.08, 70.92) = 67 ± 1.96 * 2.0
Test 2: obtained score = 63, sm = 3.0
(57.12, 68.88) = 63 ± 1.96 * 3.0
Test 3: obtained score = 50, sm = 2.5
(45.1, 54.9) = 50 ± 1.96 * 2.5
The confidence bands for tests 1 and 2 overlap so that there is probably no real difference in their scores. Test 3 however, does not overlap with the other two test and most likely represents a true differnce between test scores.

Test Reliability
Test reliability refers to consistency of measurement, the extent to which the results are similar over different forms of the same instrument or occasions of test administration.
Test Validity
Test validity is the extent to which a test measures what it proports to measure. Also, the extent to which inferences made on the basis of test scores are appropriate, meaningful, and useful.
The Measurement Model
Where
x is the obtained score,
t is the true score, and
e is the error score (measurement error).
Measurement Model Variances
Where
σx2 is the variance of the obtained score,
&sigmat2 is the variance of the true score, and
σe2 is the variance of the errors.
Standard Error of Measurement
The standard error of measurement is the square root of the variance of the errors.
When the standard error of measurement is obtained from sample data it is often written as sm or se.
Definition of Reliability
Reliability is defined and the ratio of the true score variance to the observed score variance.
Methods to Assess Reliability
use http://www.philender.com/courses/data/alpha, clear

format id - i10 %4.0f

list, nodisplay noobs

  id    i1    i2    i3    i4    i5    i6    i7    i8    i9   i10
   1     2     2     2     2     1     2     2     2     2     1
   2     2     2     2     2     2     2     2     2     2     1
   3     2     2     2     2     2     2     2     2     2     1
[some output omitted]
  33     2     2     1     1     2     1     2     2     2     1
  34     2     2     2     2     1     0     0     2     0     0
  35     2     2     2     2     2     2     2     0     2     1

alpha i1 - i10, item

Test scale = mean(unstandardized items)

                         item-test     item-rest      interitem
Item     |  Obs  Sign   correlation   correlation    covariance       alpha
---------+--------------------------------------------------------------------
i1       |   35    +       0.3527        0.2223        .0495565      0.6073
i2       |   35    +       0.3248        0.2055        .0504902      0.6102
i3       |   35    +       0.2175        0.0683        .0534781      0.6306
i4       |   35    +       0.7369        0.6015        .0323529      0.5101
i5       |   35    +       0.7160        0.5812        .0338702      0.5195
i6       |   35    +       0.7512        0.5735        .0288515      0.5016
i7       |   35    +       0.5782        0.3820        .0392857      0.5689
i8       |   35    +       0.3226        0.0187        .0544118      0.6852
i9       |   35    +       0.4662        0.3119        .0453081      0.5899
i10      |   35    -       0.1148       -0.0281        .0562792      0.6432
---------+--------------------------------------------------------------------
Test                                                   .0443884      0.6185
---------+--------------------------------------------------------------------
More Item Analysis
Here is an example of an item analysis for a multiple choice test using mctest (available from ATS). The first row of the data gives the scoring key while the second row gives the number of choices for each item.
use http://www.philender/courses/data/items, clear

list

           i1        i2        i3        i4        i5        i6
  1.        4         1         1         4         1         3
  2.        4         4         4         4         4         4
  3.        1         2         1         2         1         3
  4.        4         2         4         1         1         2
  5.        4         2         1         4         1         3
  6.        1         4         4         4         3         3
  7.        2         4         4         2         1         1
  8.        4         2         1         1         4         3
  9.        4         2         1         4         1         3
 10.        1         3         1         1         4         1
 11.        4         3         4         4         1         2
 12.        4         2         1         4         1         3
 13.        4         4         4         3         1         3
 14.        4         1         4         4         3         3
 15.        4         2         1         4         1         3
 16.        4         2         1         4         1         3

mctest i1-i6, gen(score) delete

Multiple Choice Item Statistics
Number of items: 6  Number of observations: 14
(Note: point biserials computed with item deleted)
----------------------------------------------------------------------
          Prop    Disc    Point        Prop       Proportion     Point
Item     Correct  Index   Biser   Alt  Total   Low   Mid   High  Biser
----------------------------------------------------------------------
i1       0.71     0.75    0.48     1   0.21    0.50  0.14  0.00 -0.29
                                   2   0.07    0.25  0.00  0.00 -0.39
                                   3   0.00    0.00  0.00  0.00  0.00
                                   4   0.71*   0.25  0.57  1.00  0.48
                                   .   0.00    0.00  0.00  0.00
                                 Other 0.00    0.00  0.00  0.00

i2       0.07     0.00   -0.06     1   0.07*   0.00  0.14  0.00 -0.06
                                   2   0.57    0.25  0.29  1.00  0.68
                                   3   0.14    0.25  0.14  0.00 -0.37
                                   4   0.21    0.50  0.14  0.00 -0.47
                                   .   0.00    0.00  0.00  0.00
                                 Other 0.00    0.00  0.00  0.00

i3       0.57     0.75    0.20     1   0.57*   0.25  0.29  1.00  0.20
                                   2   0.00    0.00  0.00  0.00  0.00
                                   3   0.00    0.00  0.00  0.00  0.00
                                   4   0.43    0.75  0.43  0.00 -0.20
                                   .   0.00    0.00  0.00  0.00
                                 Other 0.00    0.00  0.00  0.00

i4       0.57     0.75    0.47     1   0.21    0.50  0.14  0.00 -0.36
                                   2   0.14    0.25  0.14  0.00 -0.28
                                   3   0.07    0.00  0.14  0.00  0.05
                                   4   0.57*   0.25  0.29  1.00  0.47
                                   .   0.00    0.00  0.00  0.00
                                 Other 0.00    0.00  0.00  0.00

i5       0.71     0.50    0.07     1   0.71*   0.50  0.43  1.00  0.07
                                   2   0.00    0.00  0.00  0.00  0.00
                                   3   0.14    0.25  0.14  0.00  0.11
                                   4   0.14    0.25  0.14  0.00 -0.20
                                   .   0.00    0.00  0.00  0.00
                                 Other 0.00    0.00  0.00  0.00

i6       0.71     0.75    0.48     1   0.14    0.50  0.00  0.00 -0.57
                                   2   0.14    0.25  0.14  0.00 -0.05
                                   3   0.71*   0.25  0.57  1.00  0.48
                                   4   0.00    0.00  0.00  0.00  0.00
                                   .   0.00    0.00  0.00  0.00
                                 Other 0.00    0.00  0.00  0.00

univar score

                                   -------------- Quantiles ---------------
Variable     n    Mean    S.D.     Min      .25      Mdn      .75      Max
---------------------------------------------------------------------------
   score    14    3.36    1.50     1.00     2.00     3.00     5.00     5.00
---------------------------------------------------------------------------
Standard Error of Measurement RevisitedIn practice the standard error of measurement is obtained in the following manner.
Where
sm = se is the standard error of measurement
sx is the standard deviation of the obtained scores
r is the estimated reliability.
Types of Validity
| Sta9 | 1 | 2 | 3 | 4 | 5 | 6 | 7 | 8 | 9 |
|---|---|---|---|---|---|---|---|---|---|
| % of cases | 4% (lowest) | 7% | 12% | 17% | 20% | 17% | 12% | 7% | 4% (highest) |
| SS | -2.326 | -1.645 | -1.28 | -0.84 | -0.67 | -0.52 | -0.25 | 0.0 | +0.25 | +0.52 | +0.67 | +0.84 | +1.28 | +1.645 | +2.326 |
|---|---|---|---|---|---|---|---|---|---|---|---|---|---|---|---|
| T | 26.74 | 33.55 | 37.18 | 41.59 | 43.26 | 44.8 | 47.5 | 50 | 52.5 | 55.2 | 56.74 | 58.41 | 62.82 | 66.45 | 73.26 |
| PR | 1 | 5 | 10 | 20 | 25 | 30 | 40 | 50 | 60 | 70 | 75 | 80 | 90 | 95 | 99 |
| NCE | 1 | 15.4 | 23 | 32.3 | 35.8 | 38.9 | 44.7 | 50 | 55.3 | 61 | 64.2 | 67.7 | 77 | 84.6 | 99 |
| Sta9 | 1 | 2 | 2 | 3 | 4 | 4 | 5 | 5 | 5 | 6 | 6 | 7 | 8 | 8 | 9 |
Band Intrepretation
The formula was Xbar ± CVz * sXbar.
We can do the same thing in the area of measurement with the formula
obtained score ± CVz*sm
where
CVz is the critical value obtained from the standard normal distribution
sm is the standard error of measurement.
If you use CVz = 1.96 then you would create a 95% confidence band. The correct interpretation of this confidence band would be that the true score will be found in 95% of all such confidence bands, which is very close to saying that there is a probability of .95 that the true score for this student falls within this confidence band.
Example:
Test 1: obtained score = 67, sm = 2.0
(63.08, 70.92) = 67 ± 1.96 * 2.0
Test 2: obtained score = 63, sm = 3.0
(57.12, 68.88) = 63 ± 1.96 * 3.0
Test 3: obtained score = 50, sm = 2.5
(45.1, 54.9) = 50 ± 1.96 * 2.5
The confidence bands for tests 1 and 2 overlap so that there is probably no real difference in their scores. Test 3 however, does not overlap with the other two test and most likely represents a true differnce between test scores.
Intro Home Page
Phil Ender, 15Jan98