Stem-and-Leaf Plots (Stemplots)
     8| 3
     7| 89
     7| 0122
     6| 001133555
     5| 77788
     5| 222
     4| 56699
     4| 022
     3| 799
     3| 355
     2| 69
Box-and-Whisker Plots (Boxplots)
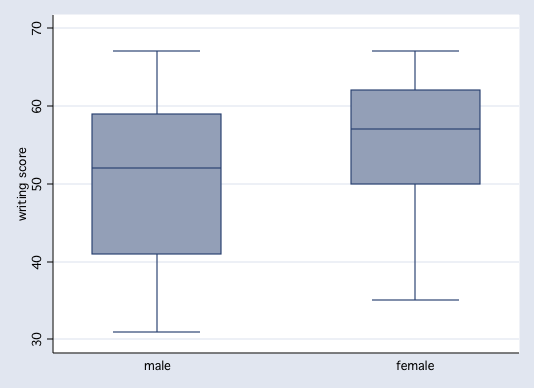
Boxplot for multiple groups.
Stata Examples
use http://www.philender.com/courses/data/hsb2, clear
summarize write, detail
writing score
-------------------------------------------------------------
Percentiles Smallest
1% 31 31
5% 35.5 31
10% 39 31 Obs 200
25% 45.5 31 Sum of Wgt. 200
50% 54 Mean 52.775
Largest Std. Dev. 9.478586
75% 60 67
90% 65 67 Variance 89.84359
95% 65 67 Skewness -.4784158
99% 67 67 Kurtosis 2.238527
univar write
/* univar is available via the Internet, net search univar */
-------------- Quantiles --------------
Variable n Mean S.D. Min .25 Mdn .75 Max
-------------------------------------------------------------------------------
write 200 52.77 9.48 31.00 45.50 54.00 60.00 67.00
-------------------------------------------------------------------------------
stem write, lines(2)
Stem-and-leaf plot for write (writing score)
3* | 11113333
3. | 5566777899999
4* | 0001111111111223444444444444
4. | 56666666667799999999999
5* | 00222222222222222344444444444444444
5. | 5557777777777779999999999999999999999999
6* | 000011112222222222222222223333
6. | 55555555555555557777777
graph box write, fxsize(50)
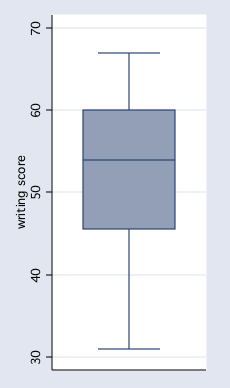 table female, contents(freq mean write median write sd write)
----------+---------------------------------------------------
female | Freq. mean(write) med(write) sd(write)
----------+---------------------------------------------------
male | 91 50.12088 52 10.30516
female | 109 54.99083 57 8.133716
----------+---------------------------------------------------
univar write, by(female)
-> female=male
-------------- Quantiles --------------
Variable n Mean S.D. Min .25 Mdn .75 Max
-------------------------------------------------------------------------------
write 91 50.12 10.31 31.00 41.00 52.00 59.00 67.00
-------------------------------------------------------------------------------
-> female=female
-------------- Quantiles --------------
Variable n Mean S.D. Min .25 Mdn .75 Max
-------------------------------------------------------------------------------
write 109 54.99 8.13 35.00 50.00 57.00 62.00 67.00
-------------------------------------------------------------------------------
graph box write, over(female)
table female, contents(freq mean write median write sd write)
----------+---------------------------------------------------
female | Freq. mean(write) med(write) sd(write)
----------+---------------------------------------------------
male | 91 50.12088 52 10.30516
female | 109 54.99083 57 8.133716
----------+---------------------------------------------------
univar write, by(female)
-> female=male
-------------- Quantiles --------------
Variable n Mean S.D. Min .25 Mdn .75 Max
-------------------------------------------------------------------------------
write 91 50.12 10.31 31.00 41.00 52.00 59.00 67.00
-------------------------------------------------------------------------------
-> female=female
-------------- Quantiles --------------
Variable n Mean S.D. Min .25 Mdn .75 Max
-------------------------------------------------------------------------------
write 109 54.99 8.13 35.00 50.00 57.00 62.00 67.00
-------------------------------------------------------------------------------
graph box write, over(female)
Notched Boxplot
(Created in R)
Intro Home Page
Phil Ender, 30Jun98