
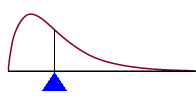
The mean is the 'center of gravity' of a distribution of scores. It is the point on which
the distribution would balance.
The Greek letter μ (mu) is used to indicate the population mean. In general, Greek letters are used to represent parameters (population values), although there are exceptions to this convention.
The sum of squared deviations about the sample mean is a minimum, i.e., &Sigma(X- )2 is
a minimum (see proof).
)2 is
a minimum (see proof).
If a distribution has an odd number of values, then the midpoint or median is the point where ther are an equal number of values above and below.
median = 20 (since two values fall above and two values fall below 20)
If a distribution has an even number of values, then the median is the point half way between to two middle-most values, i.e., just average the two middle-most values.
median = 21 (since that point is half way between the values 22 and 20)
The most important point about finding the median is that the values must be sorted before you can determine the median.
Example: [1 2 3 4 45] mean = 11 median = 3
mode = 26 median = 29 mean = 27.9
use http://www.philender.com/courses/data/hsb2, clear

summarize read write math science socst

Variable |     Obs        Mean   Std. Dev.       Min        Max
---------+-----------------------------------------------------
    read |     200       52.23   10.25294         28         76
   write |     200      52.775   9.478586         31         67
    math |     200      52.645   9.368448         33         75
 science |     200       51.85   9.900891         26         74
   socst |     200      52.405   10.73579         26         71

summarize write, detail

                        writing score
-------------------------------------------------------------
      Percentiles      Smallest
 1%           31             31
 5%         35.5             31
10%           39             31       Obs                 200
25%         45.5             31       Sum of Wgt.         200

50%           54                      Mean             52.775
                        Largest       Std. Dev.      9.478586
75%           60             67
90%           65             67       Variance       89.84359
95%           65             67       Skewness      -.4784158
99%           67             67       Kurtosis       2.238527

sort female

by female: summ write, detail

-> female=     male
                        writing score
-------------------------------------------------------------
      Percentiles      Smallest
 1%           31             31
 5%           33             31
10%           37             31       Obs                  91
25%           41             31       Sum of Wgt.          91

50%           52                      Mean           50.12088
                        Largest       Std. Dev.      10.30516
75%           59             65
90%           63             65       Variance       106.1963
95%           65             67       Skewness       -.179898
99%           67             67       Kurtosis       1.872877

-> female=   female
                        writing score
-------------------------------------------------------------
      Percentiles      Smallest
 1%           35             35
 5%           41             35
10%           44             36       Obs                 109
25%           50             37       Sum of Wgt.         109

50%           57                      Mean           54.99083
                        Largest       Std. Dev.      8.133715
75%           62             67
90%           65             67       Variance       66.15732
95%           65             67       Skewness      -.5899993
99%           67             67       Kurtosis       2.544105

table female, contents(freq mean write median write sd write)

----------+---------------------------------------------------
   female |       Freq.  mean(write)   med(write)    sd(write)
----------+---------------------------------------------------
     male |          91     50.12088           52     10.30516
   female |         109     54.99083           57     8.133716
----------+---------------------------------------------------

tabstat write, by(female) stat(n mean median sd)

Summary for variables: write
     by categories of: female

female |         N      mean       p50        sd
-------+-----------------------------------------
  male |        91  50.12088        52  10.30516
female |       109  54.99083        57  8.133715
-------+-----------------------------------------
 Total |       200    52.775        54  9.478586
-------------------------------------------------

univar read write math science socst
/* univar is not built into Stata */
/* findit univar */

                                        -------------- Quantiles --------------
Variable       n     Mean     S.D.      Min      .25      Mdn      .75      Max
-------------------------------------------------------------------------------
    read     200    52.23    10.25    28.00    44.00    50.00    60.00    76.00
   write     200    52.77     9.48    31.00    45.50    54.00    60.00    67.00
    math     200    52.65     9.37    33.00    45.00    52.00    59.00    75.00
 science     200    51.85     9.90    26.00    44.00    53.00    58.00    74.00
   socst     200    52.41    10.74    26.00    46.00    52.00    61.00    71.00
-------------------------------------------------------------------------------

univar write, by(female)

-> female=male
                                        -------------- Quantiles --------------
Variable       n     Mean     S.D.      Min      .25      Mdn      .75      Max
-------------------------------------------------------------------------------
   write      91    50.12    10.31    31.00    41.00    52.00    59.00    67.00
-------------------------------------------------------------------------------

-> female=female
                                        -------------- Quantiles --------------
Variable       n     Mean     S.D.      Min      .25      Mdn      .75      Max
-------------------------------------------------------------------------------
   write     109    54.99     8.13    35.00    50.00    57.00    62.00    67.00
-------------------------------------------------------------------------------
Intro Home Page
Phil Ender, 30Jun98